PyTorch
Machine learning framework for Python.
News
7.4.2026 PyTorch is now available on Roihu-GPU, the module has been
renamed python-pytorch.
23.1.2026 Since the LUMI service break 21.1.2026, the CSC PyTorch installations no longer work with the fast Slingshot network due to binary incompatibilities with the new drivers. This means that multi-node jobs are expected to be 10-20% slower than before. See further LUMI installation notes below.
9.1.2026 PyTorch 2.9.1 installed to Puhti and Mahti, and made the default version. Apex was removed, since the library has been deprecated for a long time already. SGLang is also not included in this version due to incompatibilities with libraries required by vLLM. Added litgpt, ultralytics, sahi and torchgeo.
New PyTorch versions for LUMI are being prepared by the new LUMI AI Factory and are expected to be released during the early spring.
8.7.2025 PyTorch 2.7.1 installed to Puhti and Mahti, and made the default version. This version includes SGLang, note however that SGLang only supports Mahti due to the older GPU architecture on Puhti.
26.6.2025 PyTorch 2.7.1 installed to LUMI, and made the default version.
Older news (click to show)
10.4.2025 PyTorch 2.6.0 installed to Puhti and Mahti, and made the default version. Includes the most recent versions of popular packages such as Hugging Face transformers, vLLM and FAISS. PyTorch geometric and related packages are no longer included, as they do not support newer versions of PyTorch.
20.1.2025 PyTorch 2.5.1 set as the default version on all supercomputers.
20.12.2024 PyTorch 2.5.1 with ROCm 6.2 added to LUMI. Includes all the usual packages plus experimental support for FAISS.
17.12.2024 PyTorch 2.5.1 added to Puhti and Mahti. Includes vLLM and FAISS among many other updates.
19.9.2024 PyTorch 2.4.1 with ROCm 6.1 added to LUMI. The LUMI PyTorch module now includes vLLM version 0.5.5 in addition to FlashAttention-2, bitsandbytes and many other frequently requested packages already added included in earlier installations. The LUMI module still uses old-style wrappers (not the tykky-based wrappers as in Puhti and Mahti).
21.8.2024 PyTorch 2.4 added to Puhti and Mahti. The LUMI installation will be delayed until after the current service break. The torchtext package is no longer included as it has been deprecated and no longer works with PyTorch 2.4.
13.6.2024 PyTorch 2.3 added to Puhti and Mahti. The LUMI
installation will be delayed until early autumn due to an incompatible
ROCm driver version. This version has also updated how Python commands
are wrapped, as this solves several problems with using virtual
environments and Jupyter Notebooks. Due to this apptainer and
apptainer_wrapper commands will no longer work, but otherwise the
change should be invisible to users.
1.3.2024 PyTorch 2.2 added to Puhti, Mahti and LUMI. The LUMI module includes ROCm versions of FlashAttention-2 and bitsandbytes as these are difficult for users to add themselves. xFormers has been added to all three systems.
17.11.2023 PyTorch 2.1 added to Puhti, Mahti and LUMI. Horovod has been removed, we recommend using PyTorch DDP instead. PyTorch Geometric was added to the Puhti and Mahti version.
5.10.2022 Due to Puhti's update to Red Hat Enterprise Linux 8 (RHEL8), the number of fully supported PyTorch versions has been reduced. Previously deprecated conda-based versions have been removed. Please contact our servicedesk if you really need access to older versions.
5.5.2022 Due to Mahti's update to Red Hat Enterprise Linux 8 (RHEL8), the number of fully supported PyTorch versions has been reduced. Please contact our servicedesk if you really need access to other versions.
4.2.2022 All old PyTorch versions which were based on direct Conda installations have been deprecated, and we encourage users to move to newer versions. Read more on our separate Conda deprecation page.
Available
Currently supported PyTorch versions:
| Version | Module | Roihu-GPU | Puhti | Mahti | (LUMI) see notes below |
Notes |
|---|---|---|---|---|---|---|
| 2.10.0 | python-pytorch/2.10 |
X | - | - | - | Default on Roihu-GPU |
| 2.9.1 | pytorch/2.9 |
X | X | - | Default on Puhti, Mahti | |
| 2.7.1 | pytorch/2.7 |
X | X | (X) | No Slingshot (see below) | |
| 2.6.0 | pytorch/2.6 |
X | X | - | ||
| 2.5.1 | pytorch/2.5 |
X | X | (X) | ||
| 2.4.1 | pytorch/2.4 |
- | - | (X) | ||
| 2.4.0 | pytorch/2.4 |
X | X | - | New tykky-based wrappers | |
| 2.3.1 | pytorch/2.3 |
X | X | - | New tykky-based wrappers | |
| 2.2.2 | pytorch/2.2 |
- | - | (X) | ||
| 2.2.1 | pytorch/2.2 |
X | X | - | ||
| 2.1.2 | pytorch/2.1 |
- | - | (X) | ||
| 2.1.0 | pytorch/2.1 |
X | X | - | ||
| 2.0.1 | pytorch/2.0 |
- | - | (X) | ||
| 2.0.0 | pytorch/2.0 |
X | X | - | ||
| 1.13.1 | pytorch/1.13 |
- | - | (X) | ||
| 1.13.0 | pytorch/1.13 |
X | X | - | ||
| 1.12.0 | pytorch/1.12 |
X | X | - | ||
| 1.11.0 | pytorch/1.11 |
X | X | - |
Includes PyTorch and related libraries with GPU support via CUDA/ROCm.
vLLM on Roihu
On Roihu we have moved vLLM to a separate module python-vllm.
The vLLM module has its own documentation page.
LUMI installations
LUMI installations - marked with "(X)" in the table above - no longer support the fast Slingshot network due to binary incompatibilities with the new drivers installed in the LUMI service break 21.1.2026. This means that multi-node jobs are expected to be 10-20% slower than before. For single-node jobs, there is no difference. The CSC PyTorch on LUMI can be considered as deprecated, and we recommend using the LUMI AI Factory-provided containers instead.
If you find that some package is missing, you can often install it
yourself using pip install. It is recommended to use Python virtual
environments. See our Python documentation for more information on
how to install packages
yourself.
If you think that some important package should be included in the
module provided by CSC, please contact our
servicedesk.
All modules are based on containers using Apptainer (previously known
as Singularity). Wrapper scripts have been provided so that common
commands such as python, python3, pip and pip3 should work as
normal.
For PyTorch version 2.2 and earlier, other commands need to be
prefixed with apptainer_wrapper exec, for example apptainer_wrapper
exec huggingface-cli. For more information, see CSC's general
instructions on how to run Apptainer
containers.
For PyTorch version 2.3 and later on Puhti or Mahti, we have used
wrappers created with the tykky
tool, and all commands provided by
pre-installed Python packages are wrapped and can be used directly. In
case you really need to run something inside the container you can
prefix with _debug_exec or run _debug_shell to open a shell
session.
New users
If you are new to using machine learning on CSC's supercomputers, please read our new tutorial Getting started with machine learning at CSC, which covers how to run a simple PyTorch project on Puhti using the web user interface.
License
PyTorch is BSD-style licensed, as found in the LICENSE file.
Usage
To use the default version of PyTorch on Roihu-GPU, initialize it with:
To access PyTorch on Puhti or Mahti:
To access PyTorch on LUMI - see the caveats about the LUMI installation above.
If you wish to have a specific version (see above for available versions), use:
Please note that the module already includes CUDA and cuDNN libraries, so there is no need to load cuda and cudnn modules separately!
This command will also show all available versions:
To check the exact packages and versions included in the loaded module you can run:
Warning
Note that login nodes are not intended for heavy computing, please use slurm batch jobs instead. See our instructions on how to use the batch job system.
Example batch script
Example batch script for reserving one GPU and a corresponding proportion of the available CPU cores in a single node:
Please read the section on Efficient GPU utilization in our Machine learning guide to learn how to use the GPU efficiently.
Big datasets, multi-GPU and multi-node jobs
If you are working with big datasets, or datasets that contain a lot of files, please read the data section of our Machine learning guide. In particular, please do not read a huge number of files from the shared file system, use fast local disk or package your data into larger files instead!
For multi-GPU and multi-node jobs we recommend using the PyTorch Distributed Data-Parallel framework. You can read more about this and find examples of how to use PyTorch DDP on CSC's supercomputers in the Multi-GPU and multi-node section of our Machine learning guide
PyTorch profiler
If your PyTorch program is slow, or you notice that it has a low GPU utilization you can use the PyTorch profiler to analyze the time and memory consumption of your program.
The PyTorch profiler can be taken into use by adding a few lines of code to your existing PyTorch program:
from torch.profiler import profile, ProfilerActivity

prof = profile(
    schedule=torch.profiler.schedule(
        skip_first=10,
        wait=5,
        warmup=1,
        active=3,
        repeat=1)
    on_trace_ready=torch.profiler.tensorboard_trace_handler('./logs/profiler'),
    activities=[ProfilerActivity.CPU, ProfilerActivity.CUDA],
    record_shapes=True,   # record shapes of operator inputs
    profile_memory=True,  # track tensor memory allocation/deallocation
    with_stack=True       # record source code information
)
In this example we opt to skip the first 10 batches and record only a
few batches for profiling. The profiling trace is saved into
TensorBoard format into the directory logs/profiler. To see all the
options, check the PyTorch API documentation for
profiler.
Next you need to start and stop the profiler, and record the individual steps (typically the batches). This would typically be around your training loop:
prof.start()

for batch in train_loader:
    # normal forward and backprop stuff here
    prof.step()

prof.stop()
In our GitHub
repository we gave a
full example with profiling:
mnist_ddp_profiler.py
with a corresponding Slurm batch job
script.
After running the job you can view the output of the profiler using TensorBoard. Start a TensorBoard session in the web interface of the supercomputer you are using. If the PyTorch profiler isn't opened automatically you may be able to find it as PYTORCH_PROFILER in the tab bar. If the tab isn't visible by default, it can be found at the pull-down menu on the right-hand side of the interface.
A particularly useful view is the Trace view (select "Trace" from the "Views" pull-down menu). Below is an example screenshot of a run of the example linked to above.
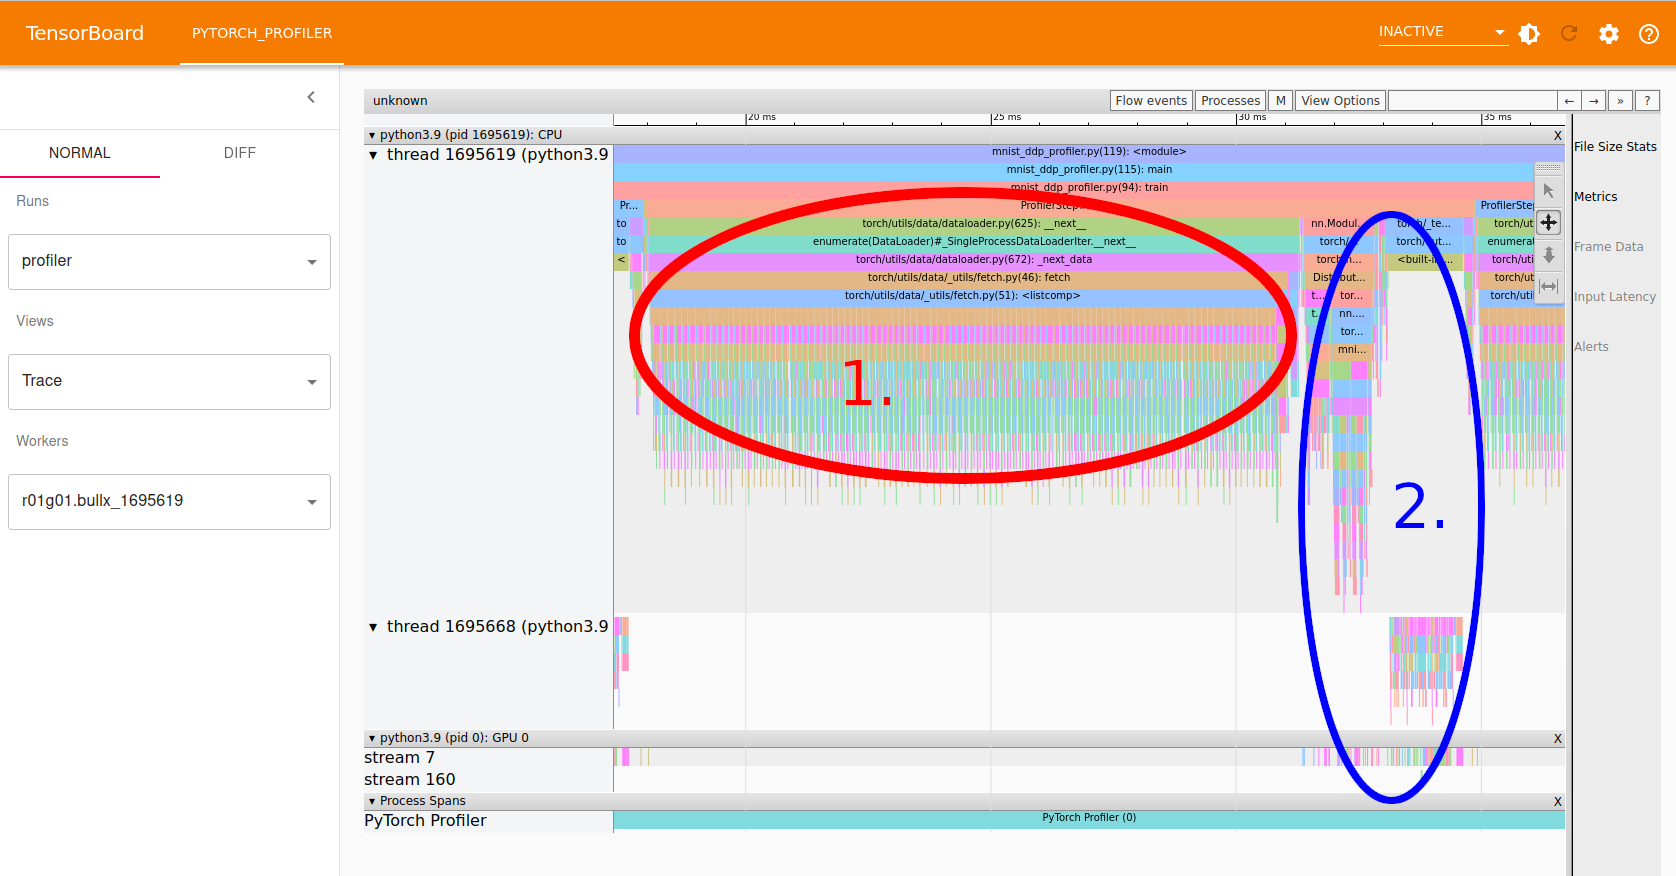
The Trace view can be zoomed in and panned using the small toolbar to the upper right, or using the 'a' and 'd' keys to pan, and 'w' and 's' for zooming in and out.
In the screenshot we can see:
- Area 1, marked with red, shows the data loading (can be seen by zooming in and reading the function names shown. This is run entirely in the CPU as it's only colored in the top part of the screen under regular python CPU threads.
- Area 2, marked with blue, shows the forward and back propagation steps. Part of this is done on the GPU, as seen by the coloring in the bottom part, in the "GPU 0" area.
Clearly this job is not utilizing the GPU well as a majority of the time is used in CPU processing. In general one could try adding more CPU cores to handle the data loading more efficiently, and increase the batch size to increase the GPU processing load. In this particular case, however, the problem is that the network is so small that it cannot really utilize the GPU fully.