Managing machine learning workflows on CSC's supercomputers
This guide discusses various ways for managing your machine learning workflows on CSC's supercomputers. It is part of our Machine learning guide.
Instead of providing a single integrated machine learning workflow system, our approach is to support a wide range of ML workflow tools so that users can pick and choose what fits their needs best.
MLflow
MLflow is an open source tool for tracking experiments and
models in machine learning projects. It is included in most of our
pre-installed modules for machine learning, such as
pytorch, tensorflow and python-data. You can also easily install
MLflow yourself with pip (see our documentation on how to install
Python packages).
We document two ways to use MLflow on CSC's supercomputers:
-
Storing the tracking data on the supercomputer's filesystem (e.g., on
/scratch/) and viewing the results via the MLflow tracking UI in the web interface. -
Using your own MLflow tracking server, for example running on CSC's Rahti service.
Option 1 is simpler to get started with - just add a few lines in your code and open the MLflow UI in the web interface - however it may not scale up very well to hundreds of runs or multiple users. For more advanced use cases we recommend Option 2.
First we'll explain how to modify your code to enable MLflow tracking.
Tracking runs
Enabling MLflow tracking in your Python code is easy. Some libraries support automatic logging with MLflow, but even if the library you are using does not, logging can be added with just a few lines of code. For example:
import mlflow
mlflow.set_tracking_uri("/scratch/project_2001234/mlruns")
mlflow.start_run(run_name=os.getenv("SLURM_JOB_ID"))
With mlflow.set_tracking_uri() we set the location where the MLflow
files should be stored, replace with the appropriate path for your own
project in the example. If you don't set a location it will create a
directory called mlruns in you current working directory.
Instead of a directory, you can also use an SQLite database, just
start the tracking location with sqlite://, for example:
Instead of setting the tracking URI in the Python code, you can also set it using an environment variable, for example in the Slurm job script:
It is not mandatory to set a name for the run, but in the example above we show how to use the Slurm job id for the name.
Finally in the code where you calculate metrics that you wish to track you need to add a line to track it with MLflow:
For a full example for PyTorch see mnist_ddp_mlflow.py or mnist_lightning_ddp.py for PyTorch Lightning.
In addition to metrics you can also log parameters and artifacts. See the MLflow documentation for a list of logging functions.
MLflow tracking UI
To visualize and monitor your runs you can start the MLflow tracking UI using the Puhti web user interface.
To launch it, log in to the web interface at
https://www.puhti.csc.fi/ and select "MLflow" from the "Apps"
menu. In the submission form you need to select where the MLflow files
are stored. This is the same path that you used for the
mlflow.set_tracking_uri() method, i.e., typically:
- a directory like
/scratch/<project>/mlruns/, or - an SQLite database like
sqlite:////scratch/<project>/mlruns.db
The default resource settings should be fine for most cases.
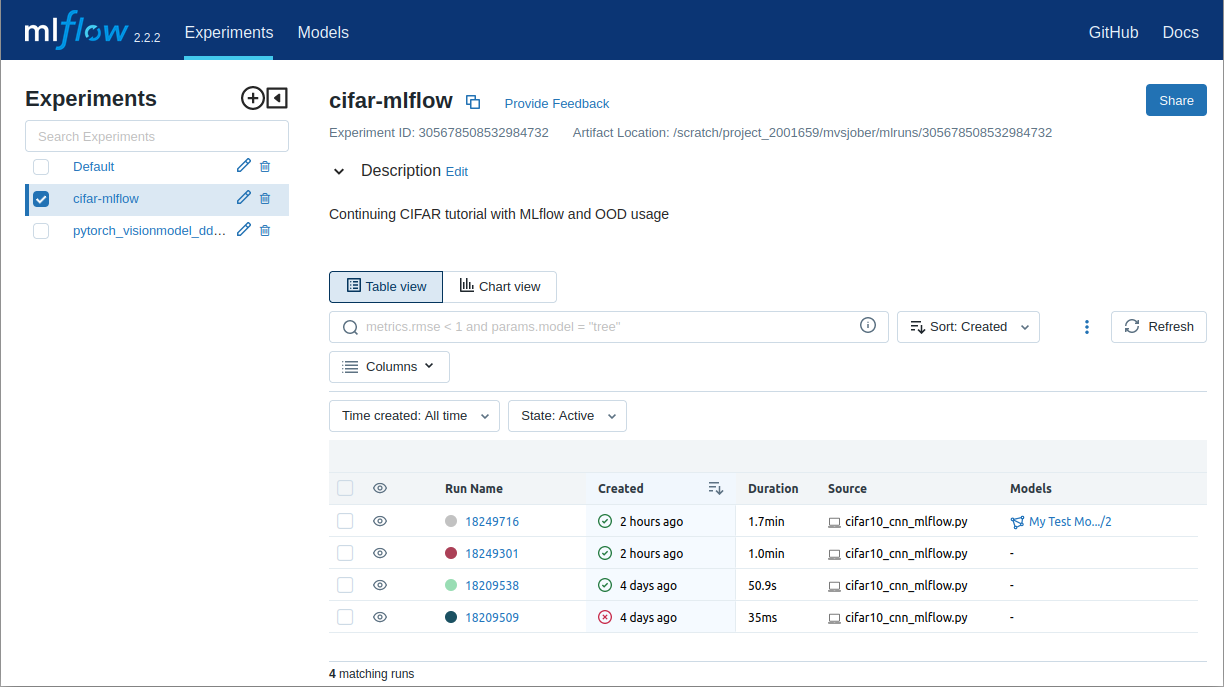
Once the session has started you should see a list of your runs similar to this screenshot:
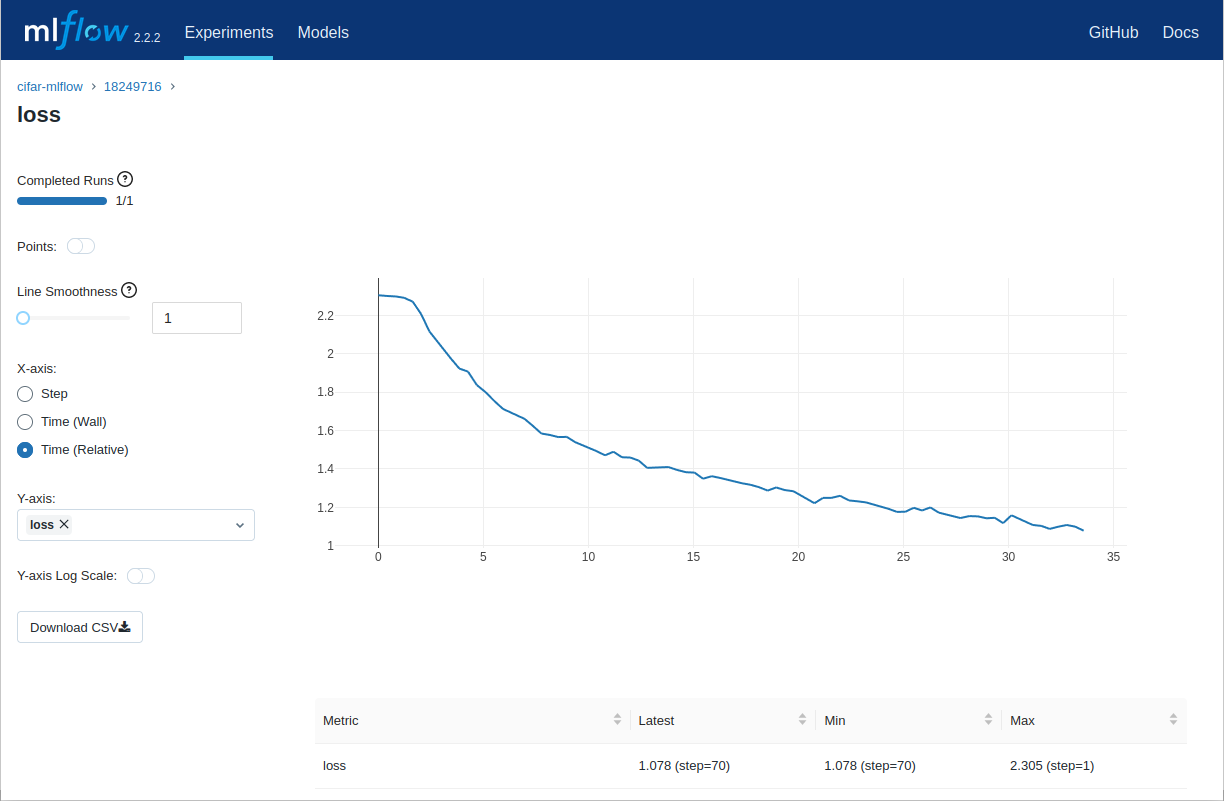
If you select a run (here named based on the Slurm id), you can for example click on the "Metrics" field and select "loss" to see a plot of that metric over time:
MLflow tracking server
For more advanced use cases you may want to use an MLflow remote tracking server. For this the tracking UI in the Puhti web interface is not suitable, as it cannot be accessed over the network, and it would typically not be running all the time when you need to store data to it.
A more suitable platform for running an MLflow tracking server is CSC's Rahti service. We have provided a ready-made MLflow template in Rahti's service catalog which makes starting an MLflow tracking server easy. See our user guide on how to start your own MLflow tracking server on Rahti. There's even a nice video!.
You can also set it up to use Allas for storing artifacts.
Once you have your server running on Rahti you can access the web user
interface. The address can be found from Rahti (Applications → Routes
→ mlflow-ui-route) and will be something similar to
https://your-mlflow-app.rahtiapp.fi, depending on what name you gave
the application in the setup. Also the username and password will be
the same ones given in the setup phase.
Next, change your Python script to point to the new MLflow tracking server:
Again, the URL depends on what name you gave to the application in Rahti. In addition, you need to set two environment variables with the username and password that you gave when creating the Rahti application, for example:
It is not very secure to store the password in a plain text file such as the Slurm job script. One option is to give the password on the command line before launching the job. If you prefix the export command with a single space (as above) the bash shell will not store the command (including the password) in its history.